4.2. Displaying a Service Configuration
In the Cluster Configuration Tool, the following information for a given <service> element is viewable directly on the Services tab (when the service configuration is fully expanded):
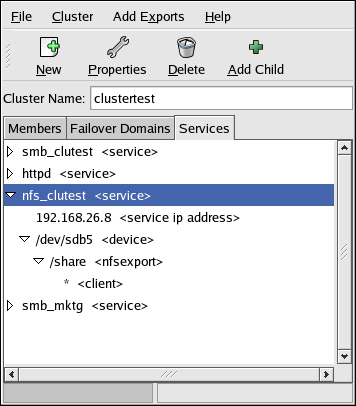
Service name
Device special file name
Service IP address
NFS export and clients (if specified) for the device
You can display the failover domain, check interval, and user script name for a <service> by accessing its properties dialog box.
The Samba share name, mount point, file system type, and mount options for a service are displayed as the properties for a <device>.
You can view the permissions for NFS client access by displaying <client> properties.
To display the properties for an element in the cluster configuration, use any of the following methods:
Double-click the element name.
Select the element name and click Properties.
Select the element name and choose File => Properties.
For instructions on configuring a service using the Cluster Configuration Tool, refer to Section 3.10 Adding a Service to the Cluster.
To display cluster service status, refer to Section 8.2 Displaying Cluster and Service Status.